Visual collaborations
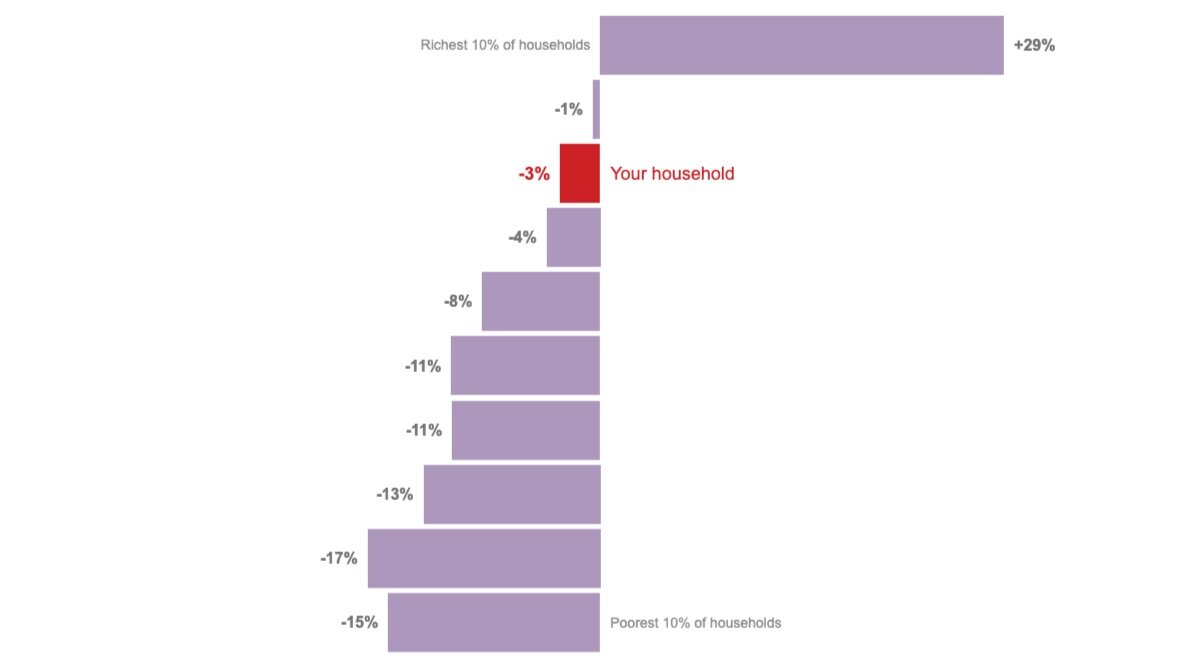
I work with a broad range of visual artists to find innovative ways of communicating my research on inequality and democracy. Notable collaborations include the Inequality Calculator, a data visualisation tool that allows New Zealanders to see where they sit on the income spectrum and understand their place in the inequality ‘story’. Originally launched in conjunction with the New Zealand Herald, it has attracted hundreds of thousands of users.
I have also worked with the award-winning cartoonist Toby Morris, whose coronavirus illustrations have been widely used across the globe. Our collaborations include the Wealth-Inequality Tower, an innovative way to communicate the reality of the wealth distribution.

I also provided research advice on Morris’s On a Plate visualisation of the way that disparities grow throughout people’s life courses, a cartoon that went viral globally and achieved millions of hits.
